Longitudinal Research with Educators on Teaching Current Events
At-a-Glance Summary
The problem space: An organization created a new product line that was a significant departure from its existing product and services. They had not done user research prior to developing the new product line and were essentially building the plane while flying it.
During the first year after launch, they needed data showing whether it was meeting the needs of its target user (teachers) and achieving the business goal of acquiring new users. This information was crucial to determine whether to continue putting resourcing into developing the product line.
This case study shows how I conducted longitudinal UX research over a period of four years to:
Help stakeholders understand how users’ behavior and needs were evolving over time
Track user retention and engagement
Measure the impact of iterative design changes over time
Read on for more details in the full case study below.
Context
About the Client
I had the privilege of working with an organization for nearly eight years that specializes in providing products and services for middle and high school teachers. Their mission is centered on cultivating empathy and civic engagement among students.
Business Goals
Although classified as a nonprofit, it is helpful to consider this organization from a business perspective. Picture a company that focuses on both B2B (school districts) and B2C (individual educators) product suites and services within the education sector.
To expand their reach and impact among educators, they aimed to acquire new leads while deepening engagement with existing customers. This led to the development of a project focused on current events, which would not only generate new customers but also offer a fresh alternative to their traditional long-form case studies and textbooks.
The Current Events Project
In 2018, a cross-functional team was established to create biweekly content in response to breaking news events that aligned with the organization’s mission.
As the UX researcher and designer on the project team for four years, my focus was on providing data-informed recommendations to colleagues for iterative design changes that would improve the usability of our resources, and connecting stakeholders with feedback from real users.
How can we better understand the needs of our audience and identify opportunities to improve our product?
Understanding the Problem
Following the first year of the project, during which over 25 resources were released, stakeholders in leadership sought to determine whether the new product line was viable as a method of acquiring new customers and whether the content was effective at filling a gap in our existing offerings. I needed to evaluate if the resources were having a positive impact so that leadership could decide whether continued investment was justified.
While metrics such as high page traffic, low bounce rates, and an average time on page exceeding five minutes indicated engagement, I recognized the need for more granular data than what aggregate tools like Google Analytics could provide. This was essential for developing comprehensive UX strategy recommendations.
Research Questions
Some of the research questions I focused on over the course of four years were:
Were teachers using our current events resources with their students? Why did they decide to use our materials vs. another resource?
What challenges or pain points did teachers have when using the resources in the classroom with their students?
What obstacles did the teachers face more generally when it came to teaching current events in the classroom?
Were they finding the resources useful and usable?
How did users modify the resources and adapt them to suit their needs? And why did they modify them?
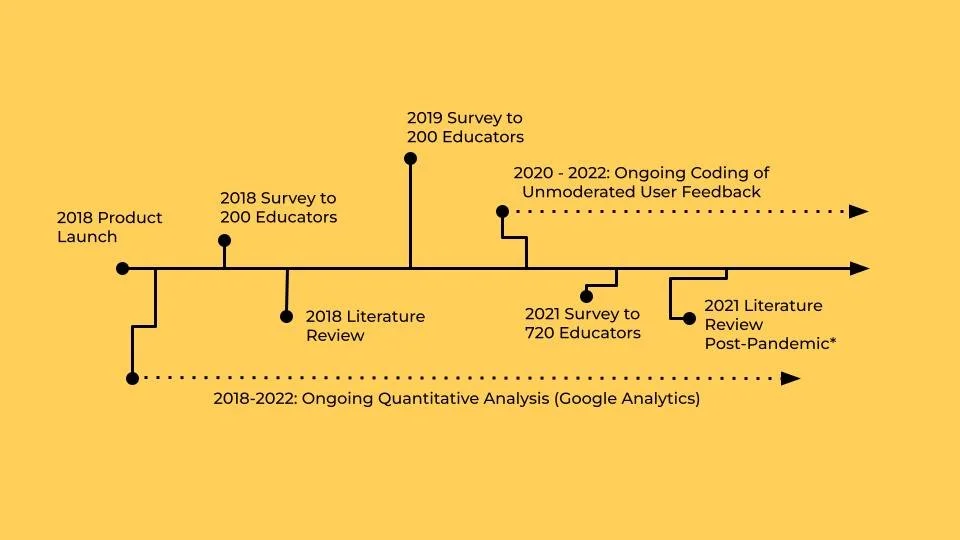
The timeline above shows the different types of research conducted over the course of the current events project from its product launch in 2018 through 2022.
In addition to ongoing analysis of behavioral metrics from Google Analytics over the course of the project, surveys were sent out in 2018 and 2019, each of which had approx. 200 respondents.
I also conducted two literature reviews in 2018 and 2021. The first review focused on the general landscape of teaching current events in a middle and high school setting. The second review, conducted in 2021, focused on how needs and conditions had changed post-pandemic (*when a national shift to online learning occurred). I also coded and analyzed feedback we received outside of surveys from 150 users over the course of the project.
In 2026, the organization continues to produce current events resources.
Selecting Methods
As a nonprofit organization focused on working with educators, my research operated within several constraints. We typically had limited to no budget to offer as incentives.
Additionally, we had to be mindful of the school year calendar during which teachers operated. Most of our users provided their work email when connecting with the organization, meaning that during the summer (when schools are closed) they became difficult to reach. This meant I had to focus on conducting research during September - May.
Despite the limitations, I was able to combine qualitative and quantitative data to draw several key insights over the course of the project which led directly to design changes and increased user retention and satisfaction.
Surveys
Given our limited time and budget constraints, I recommended creating short surveys to better understand users' motivations, needs, and pain points. By including open-ended questions, we could reach a broad audience and gather valuable individual feedback.
At that time, our project lacked the funding to offer compensation to participants and did not have the staff resources to conduct sufficient moderated one-on-one interviews to generate meaningful data.
Literature Reviews
I proactively performed a literature review and brought it to the team, framing it as a solid foundation for our working team (and our stakeholders) to ground our understanding of the existing landscape for teaching current events.
The current events project began in 2018, during a time that was extremely politically polarized in the U.S.
The review I conducted allowed us to gain deeper insights into the pain points teachers faced, such as a lack of confidence and tangible tools in tackling difficult topics with their students.
Coding Unmoderated Feedback
With the pace at which the team was generating content, I wanted to make avenues to gather feedback outside of our structured surveys. I recommended we create a dedicated point of contact to share in marketing materials, and our resources encouraged teachers to contact us with questions or feedback they had to share.
This allowed us to get a huge range of feedback outside of the questions we chose to ask in our surveys. It also allowed us to get very timely feedback (because often teachers would send feedback the day after receiving one of our teaching activities).
Analyzing Behavior on Site (Google Analytics)
Google Analytics acted as a secondary data point with which I could triangulate qualitative results. It also helped us to identify outliers (in both directions). We were able to tell in more detail which specific resources had the highest performance, and which didn’t perform well (and likely didn’t resonate with the majority of our user base).
-
For each survey, I included a mix of closed and open-ended questions about:
Which resources a person had used
How much time they typically dedicated to teaching current events
Why they decided to use them, challenges they experienced implementing the content
Which topics they would like to see covered in future product releases
How they felt the materials impacted their teaching
How they perceived the impact of the current events resources on their students
-
The key performance indicators I focused on when assessing how successful the resources were at engaging and satisfying our users were:
Page bounce rate
Time on page
Traffic to the page compared to other educator resource pages on our site, and as a percentage of overall site traffic
-
We began soliciting feedback from our user base in June 2020 and collected approx. 150 responses over the course of the next two years.
-
The two reviews, conducted in 2018 and 2021 each consisted of 8-10 sources, primarily focused from 2000 to present.
Process
Literature reviews served as a point of reference throughout our weekly meetings, and as a guidepost during our quarterly reset meetings. They also reminded us to look at the bigger picture outside of our own content, and to evaluate our resources alongside the criteria that educators had shown were most important to them throughout existing research in the field.
For each of the surveys, I began by organizing the raw survey data in a spreadsheet, followed by affinity mapping and coding the responses to identify common themes. At that time, Miro was not widely used, so I utilized a combination of Google Docs along with physical posters and sticky notes to facilitate the process.
Once I completed coding the themes, I recognized that most project stakeholders would prefer actionable key takeaways rather than an in-depth analysis of the responses.
I then presented a summary the findings to stakeholders outlining insights and recommended next steps.
Additionally, I made the cleaned data accessible to a few project teammates who wished to delve deeper into specific quotes and open-ended responses from our survey audience.
As a result of my recommendations, we implemented several modifications to our resources (detailed below) and successfully increased the number of leads generated through the product line.
For Google Analytics work, I pulled data a few key data points for each and every week for our current events meetings, including our email open and click rates, time on page, and number of views to the page. We also looked at acquisition channel to understand where our users were coming from and how they were finding our product. At our quarterly and annual planning meetings, I would do a deeper analysis of how our resources’ on-site performance compared year-over-year.
I used the additional qualitative feedback we received from 2020-2022 to study how user needs were evolving and changing in comparison to our survey results, and to see if new themes emerged. However, I kept in mind that the feedback did not carry the same weight as trends we saw in the surveys which were from a much larger audience.
Insights (2018-2019)
Expand each insight using the dropdown arrow to read more detailed findings.
-
These users fell into two groups:
Some needed resources that were already adapted because they simply didn’t have the bandwidth to create them for each lesson. If they were ready to go as part of a bundle, they would be more likely to use the product.
Others were junior teachers less further along in their careers who needed more support and scaffolding in order to create adapted resources. Having them ready to go allowed them to implement content they may not have otherwise felt confident using as a new teacher with a classroom full of diverse student learning styles.
-
Educators did their best to remain nonpartisan in the classroom, but facilitating conversation among opinionated adolescents made this difficult. They needed more support than our resources were offering at the time.
They struggled to navigate partisan politics because their comfortability with facilitating conversations on sensitive and polarizing topics was limited. And, when a person is uncomfortable or lacking in a specific skill, it’s an obstacle for them to implement that tactic in a real world setting.
-
It’s no secret that teachers in the U.S. are extremely overworked and strapped for time. While the team developing our content had set a goal to create bite-sized content that would only take one class period to use, over time, the resources had gotten longer and more detailed.
This had the effect of increasing prep time that teachers had to spend reviewing our resources to assess if they would be a good fit for them. It also led to decision fatigue because educators had to sift through the activities we provided and determine which was best for accomplishing their goal.
Insights (2020-2022)
Expand each insight using the dropdown arrow to read more detailed findings.
-
The global pandemic that began in 2020 forced a national shift to online learning for K-12 students (basically overnight).
In addition to the personal overwhelm and struggles each person was dealing with, teachers were now faced with navigating new software tools and systems to teach virtually.
From the beginning of our research, teachers had a need for adapted materials. As the project progressed, while they still needed items adapted for different reading levels, they also needed new ways to share our resources with their students. They could no longer print an activity before class and hand out a piece of paper to each person.
We began designing ready-to-go slide decks to accompany each lesson. While this meant a higher level of effort when producing the content, it made the product much more usable for a wider audience.
-
Many teachers had a goal of increasing media literacy among their students. While disinformation has always been available online, over the past decade it has ramped up significantly with the proliferation social media networks.
The number of unreliable sources, combined with the breakneck speed of news coming out as the pandemic and social unrest of 2020 carried on, meant that teachers were struggling to find trust worthy content.
When there is a lack of trust, users are less likely to take an action and make a decision.
-
Addressing breaking news is hard, especially when trying to do so in a nonpartisan way, and with adolescents whose cognitive and communication skills are still developing.
The user feedback pushed our curriculum writers to implement some creative problem-solving. They provided activities which could be used in 15 minutes, and activities which could build upon each other if a teacher had more time.
This approach empowered teachers to discuss current events with their students, even if they already had a planned lesson for the day and could only devote a few minutes to current events at the beginning of class.
-
I advocated that we listen to our users and provide what many had requested: foundational resources to build up teacher knowledge and confidence on teaching sensitive and polarizing topics.
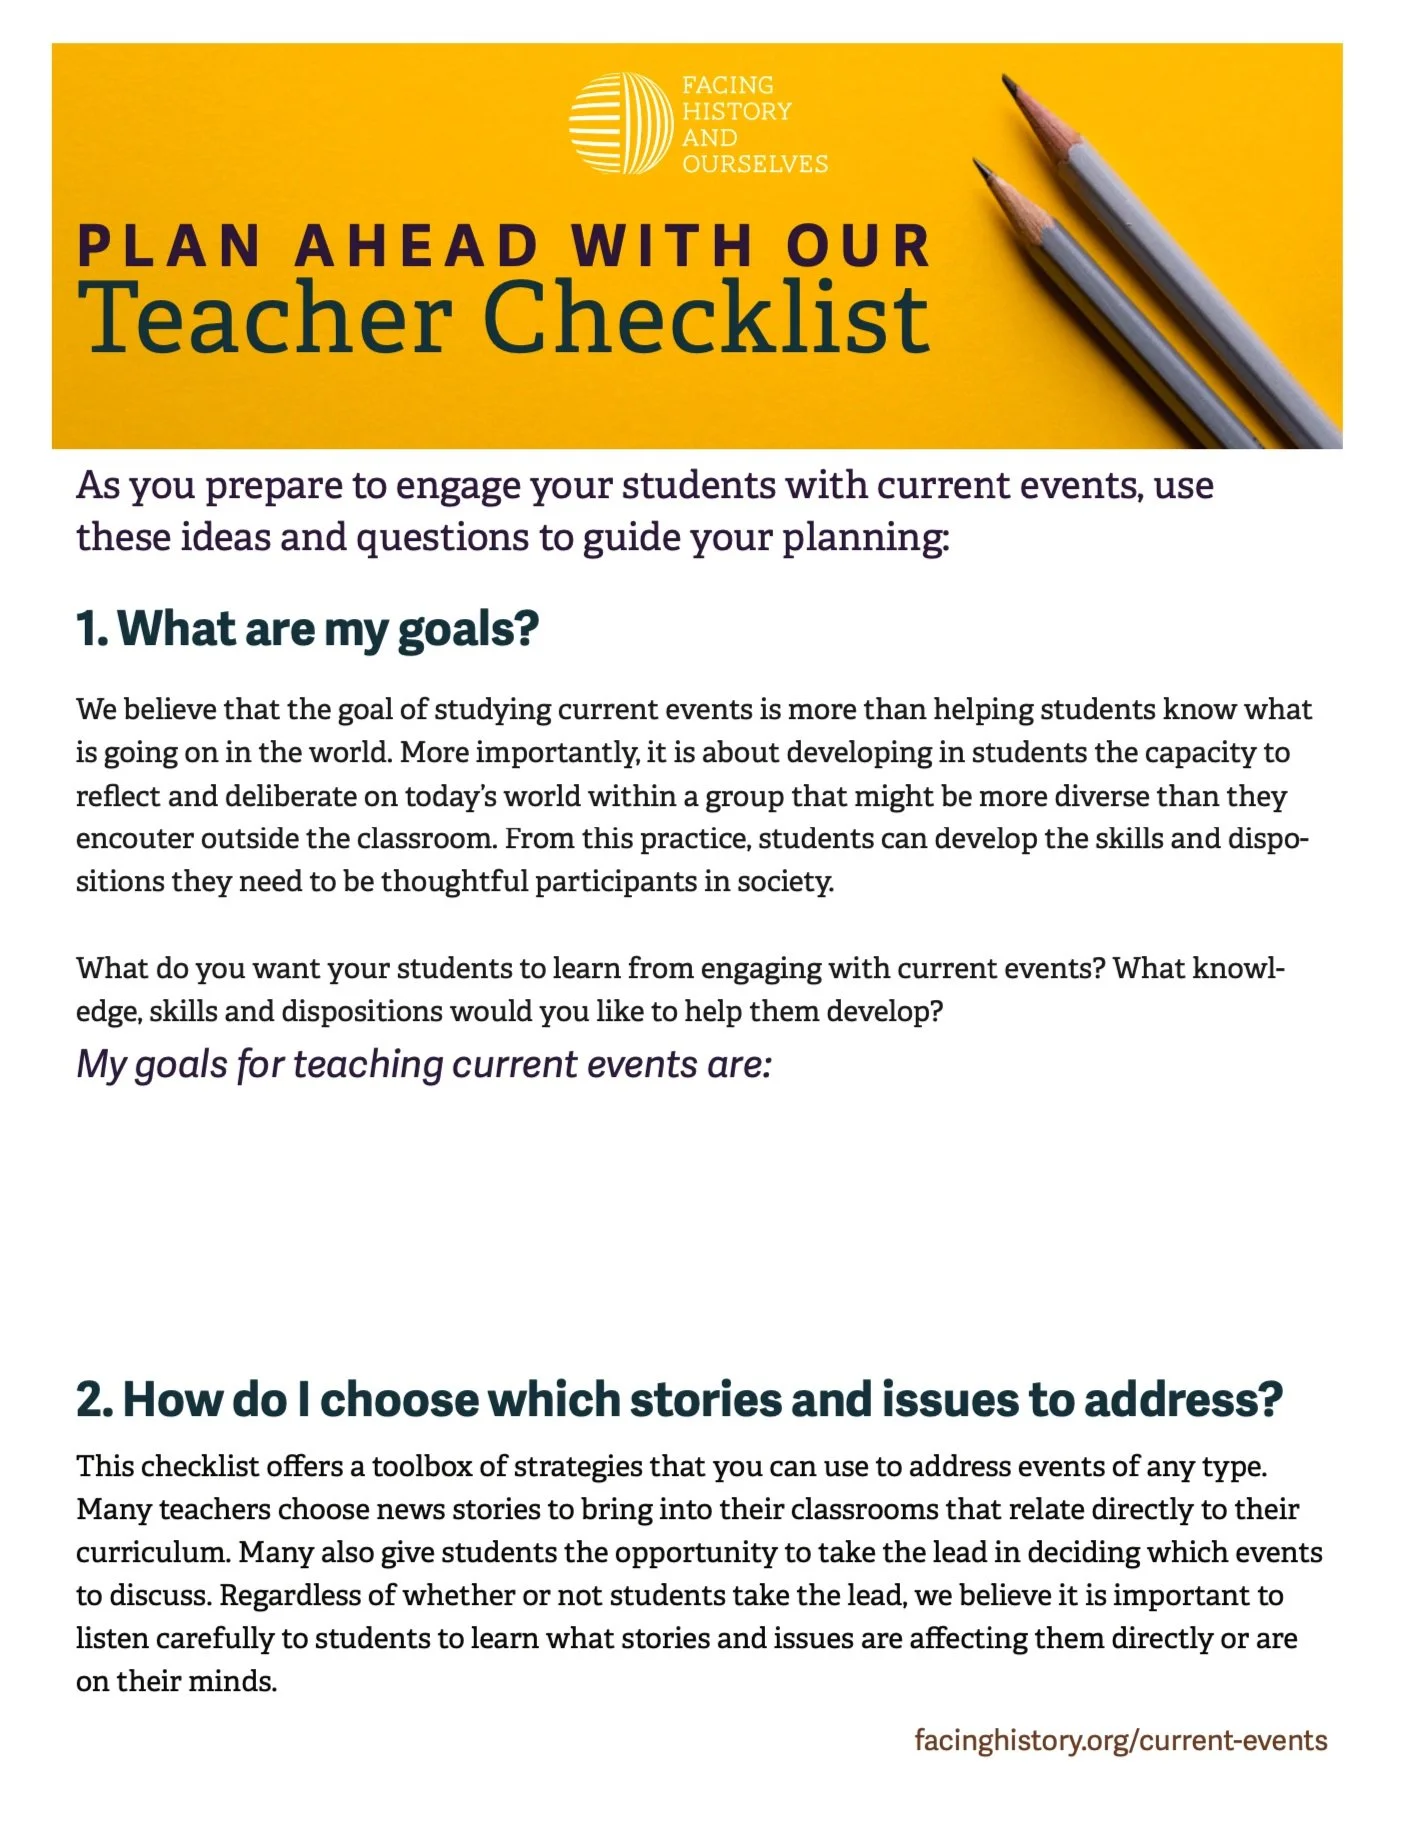
My design recommendation was to provide these materials on a webpage, but provide an additional PDF version available behind a login. This would allow us to stay in touch with new educators who downloaded specific items, and provide more personalized support to them.
Resources included a printable "Explainer" on Political Polarization, a Current Events Guide, and a larger toolkit of media literacy items.
Six years later, in 2024, these evergreen resources continue to be a big draw and have helped us acquire tens of thousands of new leads while making our users happy.
-
We began including guidance on how to modify lessons for different learning levels.
This change helped us address two feedback themes. As is common when creating more accessible materials, everyone benefits (not just those who need accommodations).
By providing suggestions on how to modify activities for different student needs, we also helped teachers who were crunched for time and needed to know how to address a topic in less elaborate and a more simple and clear way.